
Oxyhaemoglobin Dissociation Curve
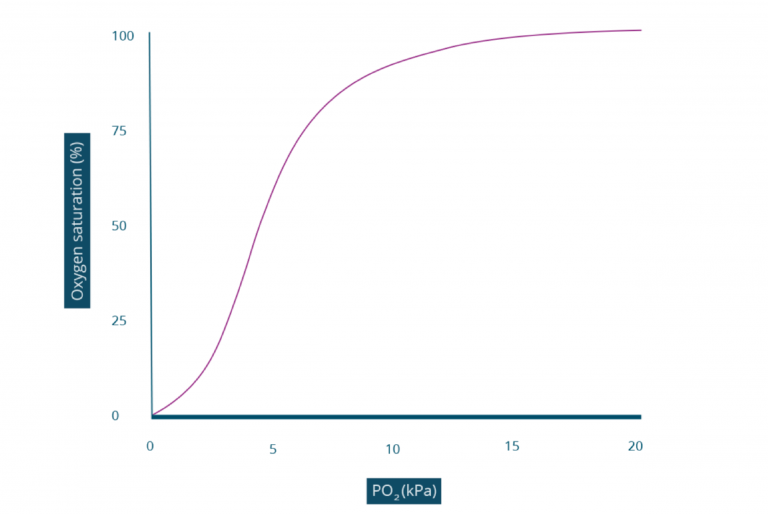
Whilst the amount of oxygen dissolved in blood has a linear relationship, the amount of oxygen bound to haemoglobin does not. The amount of oxygen bound to Haemoglobin is determined by the PO2 in a relationship represented by the oxyhaemoglobin dissociation curve.
Let’s explore the shape of the oxyhaemoglobin dissociation curve in more detail…
Flat, lower portion of the curve
On the curve, you can see that a PO2 of 0kPa will have an oxygen saturation of 0%. This represents the haemoglobin molecule completely unbound to oxygen, zero out of four binding sites have an oxygen molecule. Interestingly, in this state haemoglobin has a very low affinity for oxygen; it requires a high concentration of oxygen to “persuade” the haemoglobin to bind to the first molecule of oxygen. This is why the first section of the graph is very shallow.
Middle, steeper portion of the curve
After the first molecule of oxygen is bound to the haemoglobin molecule, the affinity for more oxygen molecules increases; oxygen molecules bind to hemoglobin more easily. The reason for this change in affinity for oxygen is the change in shape of the haemoglobin when it binds to the first oxygen molecule.
Flat, upper portion of the curve
This top portion of the oxyhaemoglobin dissociation curve represents the approach to complete saturation of haemoglobin with oxygen. The reason this portion is flat is because there are less oxygen binding sites on the haemoglobin molecule. Further increases in PO2 doesn’t make significant changes in SpO2.
When an individual’s blood PaO2 is within normal limits, and therefore their SpO2 is within normal limits, a reduction in PaO2 does not dramatically change the SpO2 because they are functioning around the upper, flat portion of the curve. In contrast, when an individual’s blood PaO2 is abnormally low, even a small reduction in PaO2 can have detrimental effects to the SpO2. This is because the individual is functioning around the middle, steep portion of the curve.
Oxyhaemoglobin Dissociation Curve
Whilst the amount of oxygen dissolved in blood has a linear relationship, the amount of oxygen bound to haemoglobin does not. The amount of oxygen bound to Haemoglobin is determined by the PO2 in a relationship represented by the oxyhaemoglobin dissociation curve.
Let’s explore the shape of the oxyhaemoglobin dissociation curve in more detail…
Flat, lower portion of the curve
On the curve, you can see that a PO2 of 0kPa will have an oxygen saturation of 0%. This represents the haemoglobin molecule completely unbound to oxygen, zero out of four binding sites have an oxygen molecule. Interestingly, in this state haemoglobin has a very low affinity for oxygen; it requires a high concentration of oxygen to “persuade” the haemoglobin to bind to the first molecule of oxygen. This is why the first section of the graph is very shallow.
Middle, steeper portion of the curve
After the first molecule of oxygen is bound to the haemoglobin molecule, the affinity for more oxygen molecules increases; oxygen molecules bind to hemoglobin more easily. The reason for this change in affinity for oxygen is the change in shape of the haemoglobin when it binds to the first oxygen molecule.
Flat, upper portion of the curve
This top portion of the oxyhaemoglobin dissociation curve represents the approach to complete saturation of haemoglobin with oxygen. The reason this portion is flat is because there are less oxygen binding sites on the haemoglobin molecule. Further increases in PO2 doesn’t make significant changes in SpO2.
When an individual’s blood PaO2 is within normal limits, and therefore their SpO2 is within normal limits, a reduction in PaO2 does not dramatically change the SpO2 because they are functioning around the upper, flat portion of the curve. In contrast, when an individual’s blood PaO2 is abnormally low, even a small reduction in PaO2 can have detrimental effects to the SpO2. This is because the individual is functioning around the middle, steep portion of the curve.